BeMetals Defines Texas Zone Targets For Phase 2 Underground Drill Program At High-Grade South Mountain Zinc-Silver-Gold-Copper Project
September 10, 2020
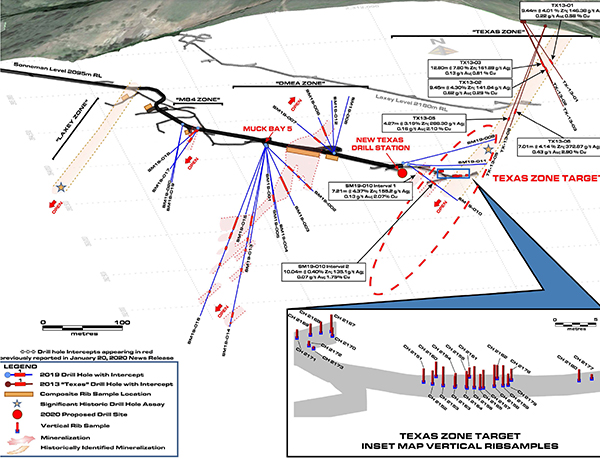
Vancouver, British Columbia – BeMetals Corp. (TSXV: BMET, OTCQB: BMTLF, Frankfurt: 1OI.F) (the “Company” or “BeMetals”) is pleased to announce it has identified several high-priority targets at the Texas Zone in advance of the Phase 2 underground diamond drilling program at the high-grade South Mountain Zinc-Silver-Gold-Copper Project (“South Mountain” or the “Project” or “Property”) in southwestern Idaho, U.S.A. The Phase 2 drilling program will focus on the Texas Zone mineralization but include some infill drilling of the DMEA Zone and test other targets from underground drilling. The high priority Texas Zone targets (See Figure 1) will be tested from a new drill station to be established from the refurbishment of an area of existing mine development last accessed in the 1980’s.
Highlights of the Texas Zone Targets:
Drill hole intersection from 2019 program
- SM19-010 Interval 1 intersected 7.21 metres (“m”) grading 4.37% Zinc (“Zn”), 155.2 grams per tonne (“g/t”) silver (“Ag”) 0.13 gold (“Au”), 0.03% lead (“Pb”) and 2.07% copper (“Cu”), and SM19-010 Interval 2 intersected 10.04 m grading 0.40% Zn, 135.1 g/t Ag, 0.07 g/t Au, 0.01% Pb and 1.75% Cu
Historical drill holes (See Table 1)
- TX13-03 Interval 12.80m grading 7.80% Zn, 161.9 g/t Ag, 0.13 g/t Au, 0.16% Pb and 0.81% Cu
- TX13-06 Interval 7.01m grading 4.14% Zn, 372.9 g/t Ag, 0.43 g/t Au, 0.92% Pb and 2.90% Cu
Historical vertical rib samples from a total of 26 samples where 8 samples analyzed below and 18 samples above 10% Zn (See Table 2). Sample highlights include:
- CH_2154 interval 1.75m grading 17.86% Zn, 495.9 g/t Ag, 9.69 g/t Au, 7.18% Pb and 0.49% Cu
- CH_2152 interval 1.81m grading 17.79% Zn, 189.1 g/t Ag, 18.44 g/t Au, 3.08% Pb and 0.22% Cu
- CH_2157 interval 2.44m grading 17.30% Zn, 42.5 g/t Ag, 7.19 g/t Au, 0.22% Pb and 0.07% Cu
- CH_2158 interval 2.93m grading 16.97% Zn, 85.9 g/t Ag, 5.16 g/t Au, 1.02% Pb and 0.12% Cu
John Wilton, President and CEO of BeMetals stated, “We are pleased to be following-up with our Phase 2 program drilling this fall. It was very encouraging that the compilation of both historical and recent drilling in the Texas Zone area defined robust targets, which are further supported by high-grade; zinc, silver, gold and copper underground rib sampling results. These vertical rib samples of high-grade Texas Zone zinc mineralization include gold grades of 9.69, 18.44, 7.19, 5.16 g/t Au over 1.75, 1.81, 2.44 metres and 2.93 respectively (See Table 2).
The successful delivery of the 2019 site activities was a testament to the strong project team relationship built between Thunder Mountain Gold, the optionees of the property, and BeMetals. Phase 2 underground drilling will focus on the Texas Zone of mineralization with the intention to confirm the grades in this area of the deposit, and to extend the known mineralization (See Figure 1). Phase 2 will commence with drilling of the DMEA Zone mineralization from an existing drill station. It is anticipated that an updated resource estimate of the deposit will be completed early in 2021. Site activities will be conducted under the management of COVID-19 standard operating procedures and policies designed to minimize this risk and establish a safe working environment.”
Figure 1: 3D Perspective View inclined at 20 degrees looking NNE, showing locations of 2019 drill holes (SM19 Series), 2013 surface drilling (TX13 Series) in the area of the Texas Zone, rib-sampling of Texas Zone, and priority Texas Zone Target
PHASE 2 DRILLING PROGRAM
The Phase 2 program is expected to include a total of approximately 25 diamond drill holes for 2,400 metres at the South Mountain project this year. Drilling is scheduled to commence from mid-September and will be conducted from a number of underground drill platforms associated with the Sonneman adit. Results from drill hole SM19-010 last year, which returned two significant intervals of copper mineralization, with historical drill holes and underground rib sampling to define the drill targets for the Texas Zone have been complied. Currently geological re-logging of the historical drill holes in the Texas Zone area to further guide and define the planned drilling is being completed.
We plan to access and enlarge the southeastern extent of the Sonneman adit in order to prepare drilling platforms closer to targets within the Texas Zone (See Figure 1). The far southeastern section of the Sonneman adit has not been accessed for some time and subsequently little underground exploration has been conducted on this zone since the 1980’s. Historically the Texas Zone of the polymetallic mineralization has been associated with an increased copper content when compared to other discrete zones within the deposit.
During our Phase 1 drilling campaign in 2019, hole SM19-010 Interval 1 intersected 7.21m grading 4.37% Zn, 155.2 g/t Ag , 0.13 g/t Au, 0.03% Pb and 2.07% copper (“Cu”), and SM19-010 Interval 2 intersected 10.04 m grading 0.40% Zn, 135.1 g/t Ag, 0.07 g/t Au, 0.01% Pb and 1.75% Cu (See Figure 1 for location), which were drilled below the Sonneman Level and into a lower extension of the Texas Zone. A number of holes are planned to test and extend this mineralization down plunge which can potentially add significant tonnage towards updating a mineral resource estimate for South Mountain in the first quarter of 2021. Following the planned 2020 drilling an improved understanding of the metal zonation, specifically related to the Texas Zone, should evolve that will assist in future exploration of the deposit. This will also improve geo-metallurgical mapping to ensure samples for metallurgical test work are representative of the style of mineralization in their nature.
Table 1 below details the results of drill holes TX13-01 to TX13-06 completed from surface, by Thunder Mountain Gold, in 2013 to explore areas associated with the Texas Zone mineralization. It is expected that the variation in metal grades relates to zonation patterns associated with the Texas Zone mineralization. Similar metal zoning patterns were identified from the 2019 drilling of the DMEA Zone. Current detailed re-logging of these historical drill holes and information from the planned 2020 drilling will provide more detail on the proportional metal content and possibly vectors to this high-grade mineralization. Table 3 includes the drill hole; Azimuth, Dip, End of hole length, Collar Co-ordinates.
Table 1. Historical Drilling Results
| Historical Borehole IDs & Intervals | From (m) |
To (m) |
Core Interval (m) |
Zn % |
Ag g/t |
Au g/t |
Pb % |
Cu % |
| TX13-01 | 89.92 | 99.36 | 9.44 | 4.01 | 146.48 | 0.22 | 0.15 | 0.58 |
| TX13-02 | 93.88 | 103.33 | 9.45 | 4.30 | 141.84 | 0.62 | 1.46 | 0.29 |
| TX13-03 | 87.78 | 100.58 | 12.80* | 7.80 | 161.89 | 0.13 | 0.16 | 0.81 |
| Including | 87.78 | 91.44 | 3.66 | 14.08 | 282.00 | 0.20 | 0.35 | 1.44 |
| Including | 96.39 | 100.58 | 3.65 | 10.76 | 268.76 | 0.20 | 0.20 | 1.34 |
| TX13-04 | Did not intersect target zone | |||||||
| TX13-05 | 158.80 | 163.07 | 4.27* | 3.19 | 288.30 | 0.16 | 0.23 | 2.10 |
| TX13-06 | 146.91 | 153.92 | 7.01* | 4.14 | 372.87 | 0.43 | 0.92 | 2.90 |
Note: Reported widths are drilled core lengths as true widths are unknown at this time. It is estimated based upon current data that true widths might range between 60-80% of the drilled intersection. Interval cut offs are based upon approximate visual contacts of massive sulphide units with no more than 3.5 metres of internal mineralised skarn. * Intersections based upon a nominal 1.0% copper cut off applied to determine the boundaries of mineralization. The author of the technical report finds the sample preparation, analytical procedures, and security measures described for the 2010-2014 programs to be reasonable and adequate to ensure the validity and integrity of the data derived from THMG’s sampling programs. (Note: See details below in QA/QC section second paragraph).
Table 2 below shows all of the results from 26 underground rib sampling completed in an area of the Texas Zone mineralization in the 1980’s by W.A. Bowes, Incorporated. The inset map on Figure 1 indicates the location and sample identification of these vertical channel samples from both the North and South ribs of the drift. The intervals of the channel samples range from 0.3m to 2.93m in length. Of the 26 rib samples analysed the results are described as follows:
- Zinc: 8 samples returned values of less than 10% zinc ranging from below detection to 6.20% Zn and 18 samples with more than 10% Zn ranging from 11.10% to 17.86% Zn.
- Silver: 10 samples returned values of less than 100.0 g/t silver ranging from 15.3 g/t to 87.5 g/t Ag and 16 samples with more than 100.0g/t Ag ranging from 111.3 g/t to 1,887.8 g/t Ag
- Gold: 6 samples returned values of less than 1.0 g/t gold ranging from below detection to 0.63 g/t Au and 20 samples with more than 1.0 g/t Au ranging from 1.25 g/t to 18.44 g/t Au.
- Lead: 11 samples returned values of less than 1% lead ranging from 0.14% to 0.95% Pb and 15 samples with more than 1% Pb ranging from 1% to 11.94% Pb.
- Copper: 21 samples returned values of less than 0.5% copper ranging from below detection to 0.49% Cu and 5 samples with more than 1% Cu ranging from 0.67% to 2.83% Cu.
Table 2. Historical Rib Sampling Results & Easting, Northing and Elevation
| Rib Sample ID | From (m) | To | Interval (m) | Zn | Ag | Au | Pb | Cu | Easting | Northing | Elevation |
| (m) | (%) | (g/t) | (g/t) | (%) | (%) | (ft) | (ft) | (ft) | |||
| CH_2151 | 0 | 1.83 | 1.83 | 13.47 | 312.81 | 5.94 | 4.16 | 0.28 | 2311971 | 393538 | 6874 |
| CH_2152 | 0 | 1.83 | 1.83 | 17.79 | 189.06 | 18.44 | 3.08 | 0.22 | 2311975 | 393534 | 6874 |
| CH_2153 | 0 | 2.56 | 2.56 | 11.48 | 323.13 | 5.00 | 5.11 | 0.13 | 2311979 | 393531 | 6875 |
| CH_2154 | 0 | 1.75 | 1.75 | 17.86 | 495.94 | 9.69 | 7.18 | 0.49 | 2311984 | 393529 | 6874 |
| CH_2155 | 0 | 2.13 | 2.13 | 14.18 | 723.75 | 10.31 | 11.94 | 0.24 | 2311988 | 393527 | 6875 |
| CH_2156 | 0 | 2.90 | 2.90 | 15.75 | 218.44 | 11.09 | 2.29 | 0.23 | 2311991 | 393526 | 6876 |
| CH_2157 | 0 | 2.44 | 2.44 | 17.30 | 42.50 | 7.19 | 0.22 | 0.07 | 2311995 | 393525 | 6875 |
| CH_2158 | 0 | 2.93 | 2.93 | 16.97 | 85.94 | 5.16 | 1.02 | 0.12 | 2312000 | 393527 | 6876 |
| CH_2159 | 0 | 2.74 | 2.74 | 15.40 | 62.50 | 4.06 | 0.79 | 0.10 | 2312004 | 393528 | 6876 |
| CH_2160 | 0 | 2.01 | 2.01 | 15.16 | 206.25 | 3.75 | 4.51 | 0.23 | 2311978 | 393546 | 6874 |
| CH_2161 | 0 | 1.28 | 1.28 | 11.10 | 60.00 | 1.88 | 1.00 | 0.17 | 2311992 | 393543 | 6873 |
| CH_2162 | 0 | 1.83 | 1.83 | 12.88 | 46.25 | 3.13 | 0.68 | 0.06 | 2312003 | 393539 | 6874 |
| CH_2163 | 0 | 1.52 | 1.52 | 3.00 | 87.50 | 5.00 | 0.47 | 0.16 | 2311983 | 393528 | 6874 |
| CH_2164 | 0 | 1.83 | 1.83 | 16.20 | 75.00 | 1.88 | 0.65 | 0.08 | 2311988 | 393526 | 6874 |
| CH_2165 | 0 | 1.95 | 1.95 | 12.48 | 111.25 | 1.72 | 0.95 | 0.09 | 2311994 | 393524 | 6874 |
| CH_2167 | 0 | 2.29 | 2.29 | 0.19 | 533.75 | 0.63 | 0.41 | 0.67 | 2311945 | 393627 | 6874 |
| CH_2168 | 0 | 1.52 | 1.52 | 0.20 | 490.31 | 0.31 | 0.23 | 2.83 | 2311940 | 393625 | 6873 |
| CH_2169 | 0 | 1.52 | 1.52 | 0.40 | 211.25 | 0.31 | 0.35 | 1.08 | 2311935 | 393622 | 6873 |
| CH_2170 | 0 | 1.16 | 1.16 | 0.00 | 15.31 | 0.00 | 0.27 | 0.00 | 2311944 | 393620 | 6872 |
| CH_2171 | 0 | 1.16 | 1.16 | 0.29 | 206.56 | 0.63 | 2.39 | 0.96 | 2311929 | 393618 | 6872 |
| CH_2172 | 0 | 0.61 | 0.61 | 6.20 | 1134.06 | 4.69 | 5.82 | 1.57 | 2311932 | 393605 | 6871 |
| CH_2173 | 0 | 0.30 | 0.30 | 13.00 | 1887.81 | 10.94 | 11.52 | 0.19 | 2311933 | 393600 | 6871 |
| CH_2177 | 0 | 0.61 | 0.61 | 16.67 | 149.38 | 1.25 | 2.70 | 0.16 | 2312043 | 393534 | 6872 |
| CH_2178 | 0 | 1.52 | 1.52 | 14.89 | 83.13 | 1.88 | 1.12 | 0.18 | 2312009 | 393536 | 6874 |
| CH_2179 | 0 | 1.52 | 1.52 | 1.70 | 29.06 | 0.03 | 0.14 | 0.05 | 2312006 | 393528 | 6874 |
| CH_2180 | 0 | 1.52 | 1.52 | 12.63 | 384.69 | 6.25 | 8.20 | 0.19 | 2312037 | 393532 | 6874 |
Based on the results of the independent author of the technical report’s site investigation and data validation efforts, considers THMG’s drilling and sampling data, as contained in the current Project database (April 1, 2019), to be reasonably accurate and suitable for use in estimating mineral resources. (Note: See details below in QA/QC section third paragraph).
Table 3. Drill Hole Azimuth, Dip, End of hole length, Collar Co-ordinates
| Hole ID & Sample Location |
Azimuth Degree |
Dip Degree |
EOH LENGTH (m) |
LENGTH (ft) |
EASTING (ft) |
NORTHING (ft) |
ELEVATION (ft) |
| SM19-001 | 040 | -82 | 45.41 | 149 | 231,176 | 394,120 | 6,868 |
| SM19-002 | 138 | -28 | 102.41 | 336 | 231,176 | 394,120 | 6,868 |
| SM19-003 | 152 | -47 | 99.97 | 328 | 231,176 | 394,120 | 6,868 |
| SM19-004 | 175 | -58 | 119.79 | 393 | 231,176 | 394,120 | 6,868 |
| SM19-005 | 175 | -53 | 98.45 | 323 | 231,176 | 394,120 | 6,868 |
| SM19-006 | 320 | +61 | 58.67 | 192 | 231,148 | 393,978 | 6,860 |
| SM19-007 | 313 | 30 | 74.07 | 243 | 231,1481 | 393,978 | 6,860 |
| SM19-008 | 050 | 50 | 85.95 | 282 | 231,1481 | 393,978 | 6,860 |
| SM19-009 | 110 | 21 | 144.47 | 474 | 231,1776 | 393,763 | 6,870 |
| SM19-010 | 150 | -13 | 117.96 | 387 | 231,1776 | 393,763 | 6,870 |
| SM19-011 | 128 | 8 | 130.76 | 429 | 231,1799 | 393,741 | 6,870 |
| SM19-012 | 003 | 68 | 77.11 | 253 | 231,1480 | 393,978 | 6,860 |
| SM19-013 | 210 | -63 | 145.69 | 477 | 231,1176 | 394,129 | 6,868 |
| SM19-014 | 210 | -61 | 271.79 | 892 | 231,1176 | 394,129 | 6,868 |
| SM19-015 | 237 | -68 | 106.07 | 348 | 231,1176 | 394,129 | 6868 |
| SM19-016 | 237 | -58.5 | 267.61 | 878 | 231,1176 | 394,129 | 6868 |
| SM19-017 | 240 | -42 | 74.06 | 243 | 231,0900 | 394,412 | 6868 |
| SM19-018 | 235 | -22 | 61.87 | 203 | 231,0900 | 394,412 | 6868 |
| SM19-019 | 205 | -45 | 91.44 | 300 | 231,0841 | 394,498 | 6863 |
| SM19-020 | 205 | -51 | 92.35 | 303 | 231,0841 | 394,498 | 6863 |
| SM19-021 | 205 | -41 | 10.06 | 33 | 231,0841 | 394,498 | 6863 |
| TX13-01 | 68 | -56.6 | 135.02 | 443 | 2312334 | 393688 | 7596.8 |
| TX13-02 | 68 | -64.9 | 126.49 | 415 | 2312332 | 393686 | 7596.5 |
| TX13-03 | 58 | -61.6 | 185.62 | 609 | 2312328 | 393687 | 7596.6 |
| TX13-04 | 266 | -62.5 | 243.23 | 798 | 2312444 | 393623 | 7596.8 |
| TX13-05 | 272 | -69.2 | 200.55 | 658 | 2312446 | 393624 | 7596.6 |
| TX13-06 | 282 | -71.5 | 174.34 | 572 | 2312445 | 393625 | 7596.5 |
THE SOUTH MOUNTAIN PROJECT
South Mountain is a high-grade polymetallic development project located approximately 70 miles southwest of Boise, Idaho (see Figure 2). The Project was intermittently mined from the late 1800s to the late 1960s and its existing underground workings remain intact and well maintained. Historic production at the Project has largely come from high-grade massive sulphide bodies that remain open at depth and along strike. According to historical smelter records, approximately 53,642 tons of mineralized material has been mined to date. These records also indicate average grades; 14.5% Zn, 363.42 g/t Ag, 1.98 g/t Au, 2.4% Pb, and 1.4% Cu were realised. Thunder Mountain Gold Inc. purchased and advanced the Project from 2007 through 2019 investing approximately US$12M during that period. The current mineral resource estimate of the deposit is detailed in Table 4 below and the Company expects to provide a revised mineral resource update following a phase 2 drilling program in 2020.
The Project is largely on and surrounded by private surface land, and as such, the permitting and environmental aspects of the Project are expected to be straightforward. Permits are in place for underground exploration activities and BeMetals does not anticipate significant barriers to any future development at the Project. Rights to the Project are secured through an Option Agreement with Thunder Mountain Gold (“THMG”), optionees of the Property, a long established Idaho based company with strong local business relationships in the state. Key management of THMG form part of the Project team.
Figure 2: Project Location Map
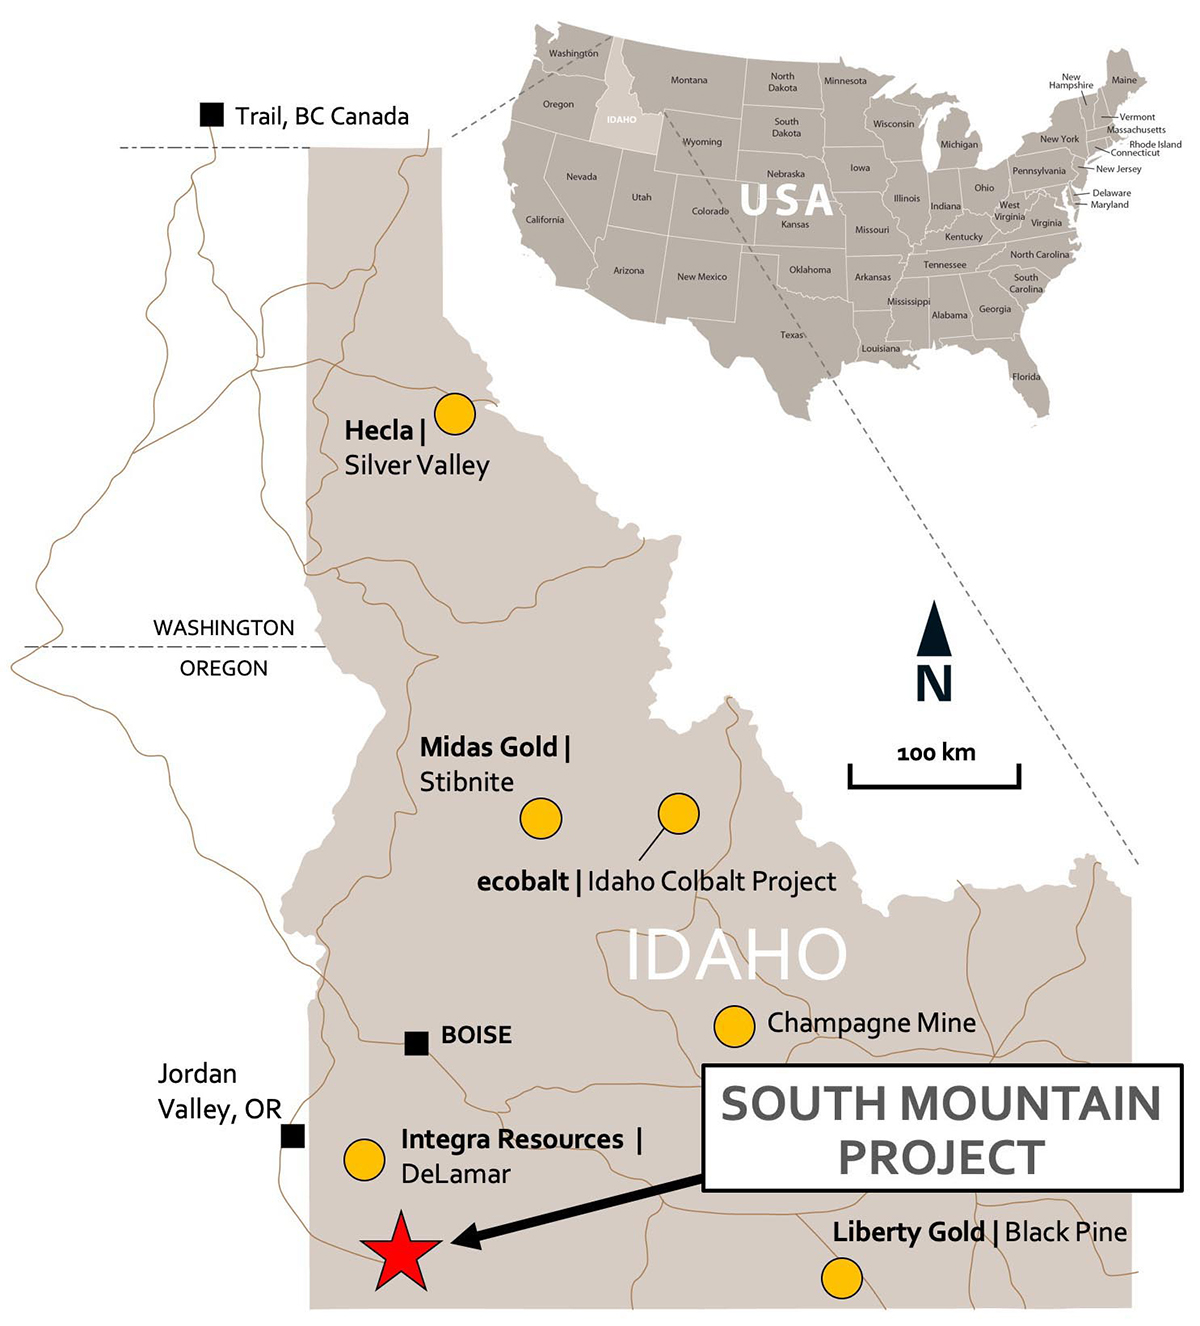
Table 4. NI 43-101 Mineral Resource Statement for the South Mountain Project - April 1, 2019
| Mineral Resources at 6.04% ZnEq Cut-off | |||||||||||||
| Classification | Zinc Equivalent Resource | Contained Metal | |||||||||||
| Short Tons | ZnEq lbs | ZnEq % | Zn lbs | Zn% | Ag oz. | Ag opt (g/t) |
Au oz. | Au opt (g/t) |
Pb lbs | Pb % | Cu lbs | Cu % | |
| x1000 | x1000 | x1000 | x1000 | x1000 | x1000 | x1000 | |||||||
| Measured | 63.2 | 22,200 | 17.57 | 14,700 | 11.64 | 237 | 3.745 (116 g/t) |
4.0 | 0.063 (1.96 g/t) |
600 | 0.483 | 700 | 0.566 |
| Indicated | 106.7 | 37,800 | 17.72 | 21,500 | 10.08 | 576 | 5.398 (168 g/t) |
7.0 | 0.066 (2.05 g/t) |
2,100 | 0.983 | 1,600 | 0.766 |
| Measured + Indicated | 169.9 | 60,000 | 17.66 | 36,200 | 10.66 | 813 | 4.783 (149 g/t) |
11.0 | 0.065 (2.09 g/t) |
2,700 | 0.797 | 2,300 | 0.692 |
| Inferred | 363.2 | 120,800 | 16.63 | 70,500 | 9.70 | 2,029 | 5.585 (174 g/t) |
16.3 | 0.045 (1.49 g/t) |
8,700 | 1.202 | 5,200 | 0.696 |
- The effective date of the mineral resource estimate is April 1, 2019. The QP for the estimate Mr. Randall K. Martin of Hard Rock Consulting, LLC, is independent of BeMetals Corp.
- Mineral resources that are not mineral reserves do not have demonstrated economic viability. Inferred mineral resources that are part of the mineral resource for which quantity and grade or quality are estimated on the basis of limited geologic evidence and sampling, which is sufficient to imply but not verify grade or quality and continuity. Inferred mineral resources may not be converted to mineral reserves. It is reasonably expected, though not guaranteed, that the majority of Inferred mineral resources could be upgraded to Indicated mineral resources with continued exploration.
- The mineral resource is reported at an underground mining cutoff of 6.04% Zinc Equivalent (“ZnEq”) within coherent wireframe models. The ZnEq. calculation and cutoff is based on the following assumptions: an Au price of US$1,231/oz., Ag price of US$16.62/oz., Pb price of US$0.93/lb., Zn price of US$1.10/lb. and Cu price of $2.54/lb.; metallurgical recoveries of 75% for Au, 70% for Ag, 87% for Pb, 96% for Zn and 56% for Cu, assumed mining cost of US$70/ton, process costs of US$25/ton, general and administrative costs of US$7.50/ton, smelting and refining costs of US$25/ton. Based on the stated prices and recoveries the ZnEq formula is calculated as follows; ZnEq = (Au grade * 43.71) + (Ag grade * 0.55) + (Pb grade * 0.77) + (Cu grade * 1.35) + (Zn grade).
- Rounding may result in apparent differences when summing tons, grade and contained metal content. Tonnage and grade measurements are in imperial units.
QUALITY ASSURANCE AND QUALITY CONTROL PROCEDURES
The Project employs a rigorous QA/QC program that includes; blanks, duplicates and appropriate certified standard reference material. All samples are introduced into the sample stream prior to sample handling/crushing to monitor analytical accuracy and precision. The insertion rate for the combined QA/QC samples is 10 percent or more depending upon batch sizes. ALS Global completed the analytical work with the core samples processed at their preparation facility in Reno, Nevada, U.S.A. All analytical and assay procedures are conducted in the ALS facility in North Vancouver, BC. The samples are processed by the following methods as appropriate to determine the grades; Au-AA23-Au 30g fire assay with AA finish, ME-ICP61-33 element four acid digest with ICP-AES finish, ME-OG62-ore grade elements, four acid with ICP-AES finish, Pb-OG62-ore grade Pb, four acid with ICP-AES finish, Zn-OG62-ore grade Zn, four acid digest with ICP-AES finish, Ag-GRA21-Ag 30g fire assay with gravimetric finish.
The 2013 historical drilling program included the following sample processing with sample preparation by ALS Chemex in either Elko or Reno facilities and sent to Vancouver, BC for final analysis using ME-ICP61 (four acid digestion-33 element ICP-AES finish)-all samples, ME-OG46 (four acid digestion-ICP-AES finish) – Cu, Pb, Zn >10,000 ppm, AG-GRA21 (fire assay-gravimetric finish)- Ag,>100 ppm, AU-AA23 (fire assay-AAS finish). Thunder Mountain Gold (“THMG”) submitted blank samples with each set of drill hole samples, and one set of duplicate samples for a single hole. No standard reference samples were submitted for analysis. A total of 14 blanks were submitted. The author of the technical report finds the sample preparation, analytical procedures, and security measures described for the 2010-2014 programs to be reasonable and adequate to ensure the validity and integrity of the data derived from THMG’s sampling programs.
Based on the results of the independent author of the technical report’s site investigation and data validation efforts, considers THMG’s drilling and sampling data, as contained in the current Project database (May 6, 2019), to be reasonably accurate and suitable for use in estimating mineral resources. Further information of the QA/QC programs for all of the historical data can be found in the Company’s technical report: Updated Mineral Resource Estimate for the South Mountain Project Owyhee County, Idaho USA, Report Date: May 6, 2019 filed on SEDAR.
About BeMetals Corp.
BeMetals is a new precious and base metals exploration and development company focused on becoming a leading diversified metal producer through the acquisition of quality exploration, development and potentially production stage projects. The Company is searching globally for an entry-level precious metals project while progressing both its advanced high-grade, zinc-silver-gold-copper polymetallic underground exploration at the South Mountain Project in Idaho, and its tier-one targeted, Pangeni Copper Exploration Project in Zambia. BeMetals’ growth strategy is led by our strong board and management, founders of the Company and significant shareholders, who have an extensive proven record of delivering considerable value in the mining sector through the discovery, construction and operation of mines around the world.
The technical information in this news release for BeMetals has been reviewed and approved by John Wilton, CGeol FGS, CEO and President of BeMetals, and a “Qualified Person” as defined under National Instrument 43-101.
On Behalf of BeMetals Corp.
“John Wilton”
John Wilton
President, CEO and Director
For further information about BeMetals please visit our website at www.bemetalscorp.com and sign-up to our email list to receive timely updates, or contact:
Derek Iwanaka
Vice President, Investor Relations & Corporate Development
Telephone: 604-609-6141
Email: diwanaka@bemetalscorp.com
Neither the TSX Venture Exchange nor its Regulation Services Provider (as that term is defined in the policies of the TSX Venture Exchange) accepts responsibility for the adequacy or accuracy of this news release
Cautionary Note Regarding Forward-Looking Information
This news release contains "forward-looking statements" and “forward looking information” (as defined under applicable securities laws), based on management’s best estimates, assumptions and current expectations. Such statements include but are not limited to, statements with respect to the plans for future exploration and development of the South Mountain and Pangeni projects, and the acquisition of additional base metal projects. Generally, these forward-looking statements can be identified by the use of forward-looking terminology such as "expects", "expected", "budgeted", "forecasts" , "anticipates" "plans", "anticipates", "believes", "intends", "estimates", "projects", "aims", "potential", "goal", "objective", "prospective", and similar expressions, or that events or conditions "will", "would", "may", "can", "could" or "should" occur. These statements should not be read as guarantees of future performance or results. Such statements involve known and unknown risks, uncertainties and other factors that may cause actual results, performance or achievements to be materially different from those expressed or implied by such statements, including but not limited to: the actual results of exploration activities, the availability of financing and/or cash flow to fund the current and future plans and expenditures, the ability of the Company to satisfy the conditions of the option agreements for the South Mountain Project and/or the Pangeni Project, and changes in the world commodity markets or equity markets. Although the Company has attempted to identify important factors that could cause actual results to differ materially from those contained in forward-looking statements, there may be other factors that cause results not to be as anticipated, estimated or intended. There can be no assurance that such statements will prove to be accurate, as actual results and future events could differ materially from those anticipated in such statements. The forward-looking statements and forward looking information are made as of the date hereof and are qualified in their entirety by this cautionary statement. The Company disclaims any obligation to revise or update any such factors or to publicly announce the result of any revisions to any forward-looking statements or forward looking information contained herein to reflect future results, events or developments, except as require by law. Accordingly, readers should not place undue reliance on forward-looking statements and information. Please refer to the Company’s most recent filings under its profile at www.sedar.com for further information respecting the risks affecting the Company and its business.